Quantcast
Channel: Alchemer
Viewing all 755 articles
Browse latest View live

Vendor Security Risk Assessment Simplifies InfoSec

$
0
0

by Michael Kleck, Director of Compliance and Information Security at Alchemer, and Brett Gedvilas, Information Security Analyst at Alchemer 

Running security risk assessments is one of the most thankless jobs in information security. Yet it’s necessary to keep your InfoSec process strong. So, you send out a standard form to a vendor or to your internal team and then hound them to return it. People leave sections blank or don’t get the right information because they don’t know how to share the spreadsheet or answer the questions. Completing the assessment takes weeks, not to mention the days of your time because you must go back and forth with people to get the answers you need. 

And when it all takes longer than everybody hoped, Information Security is seen as a pinch point in the purchasing process. Which isn’t half as bad as getting blamed when something goes horribly wrong because somebody didn’t follow protocol and identify then mitigate risks.  

This is why risk assessments are a critical component of your Security Program, as well as any security standards you want to tout, including ISO-27001 or SOC compliance. So how do you perform risk assessments quickly and painlessly while still doing everything else on your list? 

Manage Risk, Not Questionnaires 

Given our own struggles with completing internal risk assessments as well as external ones for vendors, Alchemer developed the Risk Assessment Solution to be a flexible and automated process for conducting vendor and enterprise risk assessments. We even made it easy to break out the questions so the right person within any organization can answer them and to only ask the questions relevant to that vendor type instead of one-size-fits-all. And we automated the notifications, so you know when the survey is complete.  

In short, it gives InfoSec teams more time for managing and mitigating risks rather than trying to track down fifty questions on a spreadsheet. The solution includes a complete suite of pre-configured surveys, workflows, and risk reports, so information security can focus on acting on their data, rather than collecting it.   

Focus on Information Security, not Irrelevant Questions 

We’ve all received a form or spreadsheet that had more questions that were irrelevant than were relevant simply because it’s easier to ask all the questions than miss one. You can create custom surveys for software vendors that will store customer data, independent contractors, and web-based applications that help people manage their calendars or the like.  

Because you can send over only the questions that matter, people are more likely to complete the survey. And you don’t have to wade through unanswered questions wondering if they missed it or it wasn’t relevant. Stop passing spreadsheets around like a game of telephone and get the right answers from the right SME the first time. This allows your security team to make accurate and informed decisions early in the process. 

Make Your Life Easier 

With the Alchemer Risk Assessment Solution, your InfoSec team selects the type of vendor, automatically adjusting the questions and default risk level, and sends a link to the assessment. The vendor can assign specific sections of the assessment to be completed by different team members and attach copies of requested policies. When the assessment is complete, the InfoSec team is notified, the raw scores are compiled automatically, and any raw score can be adjusted.  

At Alchemer, we took our vendor risk assessment process and incorporated it into our PO request workflow. If an employee submits a purchase order that requires an InfoSec review, the internal vendor risk assessment is automatically sent to the employee. Only once the employee completes the internal vendor request and it’s approved can the PO move forward in the process. 

In the end, you have a stronger information security program because manually collecting risks is no longer a problem. To strengthen your InfoSec program, learn how the Alchemer Risk Assessment Solution can save you time and help you build a strong InfoSec process. 

The post Vendor Security Risk Assessment Simplifies InfoSec appeared first on Alchemer.


Three Ways to Make Your Exports Easier to Read

$
0
0

by Mike Cronley

Exporting the data you collect in Alchemer to a CSV or Excel format can create some challenges when you try to sift through the exports to view your survey response data simply. Fortunately, we have a few tips to help! 

In the example survey below the respondent answered the first two questions this way.

car brand study survey

Problem:

The export generated for those questions will look like this:

However, this is not the easiest export to read for three reasons: 

  1. Each column’s width needs to be expanded to view the complete question title. 
  1. The question numbers aren’t visible.  Where does question one end and question two begin? 
  1. The answers for the two checkbox questions are spread out across numerous columns. 

Solutions: 

1. Use an alias for the question titles. 

Using an alias, such as Q1 for Question 1 will give you a clearer export. 

Customize the Header Format to Show Question Numbers. 

You can also customize your header format to Show Question Numbers, making the export easier. 

Select Show checkboxes as a Single Column. 

Before exporting, go to: Results > Exports > CSV/Excel > Create Report > Settings to make these selections. 

Now when the export is run it will display like this: 

The question numbers and the aliases appear in the headers. The checkbox answer options selected are grouped together in one column. 

The post Three Ways to Make Your Exports Easier to Read appeared first on Alchemer.

May 2021 Monthly Insider

$
0
0

Welcome to the May 2021 edition of the Alchemer Monthly Insider newsletter. Each month, we will share product and solution news, use cases, and other helpful information. Is this information valuable? Is there more you want to hear from us? Please provide your ideas and feedback using the survey at the end of the newsletter. 

Forrester Consulting and Alchemer

Why Customer Experience Programs Miss Their Mark

A new Forrester Consulting study finds the vast majority of Customer Experience (CX) and Voice of the Customer (VoC) programs fail to respond to customer feedback. The key findings….. read more

Download the Report

Watch the Webinar

View other Alchemer webinars on BrightTALK

DEI&B

DEI&B

Diversity, Equity, Inclusion, and Belonging (DEI&B) topics have recently come to the forefront of our thinking. But are you just checking a box or is your strategy truly adding value to your organization? Listen to this insightful Alchemer webinar to learn how to foster an inclusive and equitable working experience for your employees with a comprehensive and well-executed DEI&B strategy.

Complete this survey for more information on creating a DEIB framework.

Watch the webinar.

Learn how to write gender questions in a survey.

What’s New from Alchemer University?

Regardless of how much work and thought went into your project setup and launch, all that effort could fall flat without effective analysis and reports. Fortunately, Alchemer offers excellent reporting capabilities that often get overlooked.  

Check out the new courses.

Looking to Solve Something Else?  

You will find all of the Alchemer University courses in the Alchemer application at the bottom of the left-hand navigation menu.

Alchemer Panel Services

The Alchemer Panels team consists of seasoned professionals with deep expertise in finding the ideal audience, guiding clients in how to get the most from Panels, and ultimately, collecting the information and insights they need to make the best decisions possible. The team’s secret sauce is not just managing the mechanics of reaching your desired target audience quickly, efficiently, and cost-effectively, which they do exceptionally well; but rather, ensuring that the data collected is clean, high-quality, and actionable.

We can help you and your business.

Vendor Security Risk Assessment Simplifies InfoSec

Running security risk assessments is one of the most thankless jobs in information security. Yet it’s necessary to keep your InfoSec process strong. The Alchemer Director of Compliance and Security walks us through managing risk, not questionnaires. Read more.

Tips & Tricks

Three Ways to Make Your Exports Easier to Read 

Exporting the data you collect in Alchemer to a CSV or Excel format can create some challenges when you try to sift through the exports to view your survey response data simply.

Fortunately, we have a few tips to help!

Thank you 

Thank you for reading our May newsletter. If you have an interesting story about using Alchemer, or want to provide feedback on this issue, please reach out to us by filling out this quick survey. Thank you for your business. 

The post May 2021 Monthly Insider appeared first on Alchemer.

Alchemer University Improves Your Export Game

$
0
0

Two New Alchemer University Classes Make Exporting Data Easier 

By Alli Milne and Andrew Sturtz 

When you need to export survey data from Alchemer, how you export it can save you a lot of time before your final analysis. While reports provide an aggregated view of the data, along with ways to visualize the data (such as charts and summary tables), exports provide a raw form of the data. Exports allow you to view all of the responses individually, rather than as an aggregated view. 

Exports are mostly used to import the raw data into other third-party systems or databases, such as your CRM (like Salesforce), data lakes, or analysis solutions such as SPSS, Microsoft Excel, or Business Intelligence solutions (such as Tableau or PowerBI). 

These new courses will help you export data for ease of use and viewing.  

The new Exports Courses include: 

  • Course 1: Overview of Exports 
  • Course 2: Project Elements in Exports 

Course 1: Overview of Exports  

By the end of this course, you will be able to:  

  • Understand the use case and functionality of Exports  
  • Customize a CSV Export  
  • Share an Export  

Course 2: Project Elements in Exports  

By the end of this course, you will be able to:  

  • Identify how the data from different question types populates in Exports  
  • Identify how Reporting Values and Aliases populate in Exports  
  • Identify how Piped Data populates in Exports  

New! Alchemer University Feedback Survey  

How are we doing? We’re looking for feedback on your Alchemer University experience so far. If you’ve taken a course, let us know how useful it was by completing the survey within the Reports Program, or you can click here to take it now:  https://survey.alchemer.com/s3/6314076/exports  

Start learning what’s possible 

Since the first program was released in early 2020, more than 23,000 Alchemer users have successfully enrolled and participated in AU Courses to increase their knowledge and usage of the application. Check out our other programs as well:  

  • Beginning Essentials Level 1  
  • Beginning Essentials Level 2  
  • Account Administration  
  • Building Advanced Questions  
  • Actions 
  • Logic  
  • Style  
  • Email Campaigns  
  • Distribution  
  • Managing Responses 
  • Reports 

The post Alchemer University Improves Your Export Game appeared first on Alchemer.

An Introduction to the Chi-Square Test & When to Use It

$
0
0

Alchemer is a powerful online survey and data collection platform that allows you to perform very advanced analysis, such as the Chi-Square test. Being able to investigate whether the data from two questions are correlated helps market researchers better understand context in their findings.

What is the Chi-Square Test?

The Chi-Square test is a statistical procedure used by researchers to examine the differences between categorical variables in the same population. 

For example, imagine that a research group is interested in whether or not education level and marital status are related for all people in the U.S. 

After collecting a simple random sample of 500 U.S. citizens, and administering a survey to this sample, the researchers could first manually observe the frequency distribution of marital status and education category within their sample. 

The researchers could then perform a Chi-Square test to validate or provide additional context for these observed frequencies.

Chi-Square calculation formula is as follows:

Chi-Square calculation formula. 

When is the Chi-Square Test Used in Market Research?

Market researchers use the Chi-Square test when they find themselves in one of the following situations:

  • They need to estimate how closely an observed distribution matches an expected distribution. This is referred to as a “goodness-of-fit” test.
  • They need to estimate whether two random variables are independent.

When to Use the Chi-Square Test on Survey Results

The Chi-Square test is most useful when analyzing cross tabulations of survey response data. 

Because cross tabulations reveal the frequency and percentage of responses to questions by various segments or categories of respondents (gender, profession, education level, etc.), the Chi-Square test informs researchers about whether or not there is a statistically significant difference between how the various segments or categories answered a given question.

Important things to note when considering using the Chi-Square test

First, Chi-Square only tests whether two individual variables are independent in a binary, “yes” or “no” format.

Chi-Square testing does not provide any insight into the degree of difference between the respondent categories, meaning that researchers are not able to tell which statistic (result of the Chi-Square test) is greater or less than the other.

Second, Chi-Square requires researchers to use numerical values, also known as frequency counts, instead of using percentages or ratios. This can limit the flexibility that researchers have in terms of the processes that they use.

What Software is Needed to Run a Chi-Square Test?

Chi-Square tests can be run in either Microsoft Excel or Google Sheets, however, there are more intuitive statistical software packages available to researchers, such as SPSS, Stata, and SAS. 

Check out this article on Exporting Your Survey Data with SPSS to learn how to get started today!


The post An Introduction to the Chi-Square Test & When to Use It appeared first on Alchemer.

Adding Quantitative Research Questions in Online Surveys

$
0
0

One of the things that makes Alchemer a powerful online survey and research platform is the sheer number of question types you have access to as a user. This flexibility also allows you to add different question types to any survey, so you don’t have to choose between quantitative and qualitative questions in your survey. You can have both.

If you’re unsure of the difference between quantitative and qualitative, read the article, Does your Consumer Survey Data Paint The Whole Picture. This blog explores the differences between the two question types but here is the short version:

  • Quantitative questions will tell you Who and What.
  • Qualitative questions will tell you Why.

Quantitative questions are easier to measure and easier for survey takers to answer. Qualitative questions, on the other hand, are subjective and harder to measure. They are also harder for survey-takers to answer and too many can lead to survey fatigue.

Qualitative questions (like open textboxes or essay questions) are great for the exploratory phase of your research project or to delve deeper into a matter, but you want to use them sparingly. Don’t tire your survey-takers or yourself. Trying to analyze essay question answers to find a common theme can be arduous and time-consuming.

One way to make qualitative questions easier on both of you is to use Video Feedback questions, which allow people to respond with a video, rather than writing out their answers.

If you need hard statistics or quantifiable numbers, use quantitative questions. You can assign numeric values for easy, objective measurement and comparison.

Quantitative questions are close-ended which makes them easy to answer. You can ask a lot of these questions without tiring survey respondents. But you’ll want to mix up the question types to keep your survey interesting and your respondents engaged.

In this article we will explore the different ways to ask quantitative questions in your online survey.

How to Phrase Quantitative Questions

Quantitative questions typically start with how or what. Some common leading phrases include:

  • How many?
  • How often?
  • How frequently?
  • How much?
  • What percentage?
  • What proportion?
  • To what extent?
  • What is?
  • What are?

Here are some quantitative question examples:

  • How many text messages do you send a day?
  • How frequently do you text while driving?
  • How often do you send text messages while at work?

Be sure to identify all of the variables that might affect the outcome. Also be sure to include all of the groups you are interested in. Neglecting to recognize variables and groups involved will create gaps in your data that will make it hard for you to base sound decisions on.

In the example above, work and driving are variables that likely alter texting behavior. In this example, you could also collect demographic information such as age, gender, and job function so you can compare texting habits between these groups.

Quantitative Question Types

Most online survey tools offer an array of answer formats. This is good news, as these various options will engage your customers and reduce survey fatigue.

Mix up these close-ended question types to increase your response rate:

  • Radio Buttons
    This standard question type is the most common single-select question type. Unlike checkboxes, respondents can only choose one answer option. These are typical yes/no, true/false, either/or answer options. Perhaps you only want to know the single most important feature your customers love.

    Radio Button Example:
    radiobutton


  • Checkboxes
    This is another old standard and is the most common multi-select answer question type. It allows respondents to select all of the answer options that apply. An example would be if you wanted to allow your customers to select all of their favorite features.

    Checkbox Example:
    Checkbox question type example

  • Drop Down Menus
    These can be configured to be single or multi select answer option. These are great if you have a long list of answer options but don’t want your survey to appear lengthy.

    Drop Down Menu Example:
    dropdown-Menu

  • Drag and Drop
    This newer question format is very interactive. Engage your customers by allowing them to rank answer options dragging and dropping answers in the order they choose.

    Drag and Drop Example:
    drag-drop

  • Likert Scale
    This rating scale makes it easy for customers to rate their answer and easy for you to evaluate. The numeric reporting scale can be customized. A scale of 1-5 or 1-10 are the most popular reporting options.The answer options apppear as radio buttons.

    Likert Scale Example:
    likert-scale

  • Slider Scale
    The sliding scale question type can be configured as a single-select or multi-select question type. It is another great option for allowing customers to rate their response on a sliding scale. You can choose the scale and label them. These are engaging and fun.

    Sliding Scale Example:
    slider

  • Star Ranking
    The Star Ranking question allows customers to rate criteria based on different categories defined by the row and column headers. Each star represents an equivalent numeric value and typically ranges from 1 to 5. tar ranking Is great for rating books and movie but should be used with caution as they tend to create a positive bias.

    Star Ranking Example:
    star-ranking

  • NPS
    The Net Promoter Score allows you to gauge customer loyalty. According to industry standards, a 0 -10 scale is used to ask customers how likely they are to recommend your product or service. A score is automatically determined based on the percentage of promoters less the percent of detractors.

    Net Promoter Score Example:
    nps

  • Image Select
    This question type can be configured to be a single or multi-select answer option. Respondents select an image answer based on a set of set of images. This is great for your market research surveys where you would like respondents to choose which image they find most appealing.

    Image Select Example:
    image-choice

  • Matrix
    These tables can be configured as a single answer or multiple answer option. Columns are set up as categories with the answer options appearing in the rows. These are great for condensing your survey when categories have the same answer option. They allow you to get the answers as one question rather than setting up multiple questions.

    Matrix Example:
    tableRadioButton

Considerations When Choosing Quantitative Question Types

While it is nice to vary your question types to keep respondents interested, it is important to consider the reporting options. Some question types report in bar and pie charts where others may not. Always test your survey and check the reports to ensure you are collecting the data in the format that best suits your needs.

Also consider the type of device your respondents will be using. Interactive question types are engaging but may not be reliable on all mobile devices. Long matrix tables can be frustrating on a mobile device since the radio buttons or checkboxes are small. Image select questions may not render properly or take too long to load.

Use “Other” as Answer Option When Necessary

Hopefully you have considered all of the relevant answer options when crafting your quantitative question. Of course, it is now always possible to include every answer option.

If you are fearful of not including an answer option, use an “Other” answer choice and provide a textbox so respondents can specify the alternative. These are easy to setup when using a radio button or checkbox question type.

If your question is well designed, the “Other” answer option should be the exception rather than the rule. Analyzing the textbox information should not be too arduous since there are likely only a few of them. If more than 50% selected “Other “ as the answer option than perhaps you needed to do some exploratory research.

Quantifiable Results

So there you have it; 10 different quantitative question types that will keep your survey interesting and your respondents engaged. But the best part is that you will have quantifiable data that you can act on!

Related Articles:
Does You Consumer Survey Data Paint The Whole Picture: When to Use Qualitative Vs. Quantitative Research Questions
Quantitative Vs. Qualitative Research – When to Use Which
Using Qualitative Exploration To Create Quantitative Surveys
Using Highly Interactive Questions In Online Surveys

The post Adding Quantitative Research Questions in Online Surveys appeared first on Alchemer.

Why You Should Consider Secondary Data Analysis for Your Next Study

$
0
0

Alchemer is an incredibly robust online survey software platform. It’s continually voted one of the best survey tools available on G2, FinancesOnline, and others. To make it even easier, we’ve created a series of blogs to help you better understand how to get the most from your Alchemer account.

What is Secondary Data Analysis?

Secondary data analysis involves a researcher using the information that someone else has gathered for his or her own purposes. Researchers leverage secondary data analysis in an attempt to answer a new research question, or to examine an alternative perspective on the original question of a previous study.

In order to fully understand secondary data analysis, it’s essential to familiarize yourself with the difference between primary and secondary data.

Primary Data vs. Secondary Data

Primary data is original data that researchers collect for a specific purpose.

Secondary data, on the other hand, is collected for a different purpose other than the one for which it is used. 

To add context to the definition of secondary data, let’s consider an example.

If an entrepreneur is considering opening a new business, he or she could leverage census data that has been collected by the government. 

Although the entrepreneur would not be collecting the data his or herself, census data includes information that could greatly benefit the entrepreneur, such as the average age, household income and education level in a particular geographical region.

By digging into this census data to inform the decision of whether or not the entrepreneur should open the new business, the entrepreneur is performing secondary data analysis.

Factors to Consider Before Conducting Secondary Data Analysis

There are certain factors that a researcher must consider before deciding to move forward with secondary data analysis. 

Because the researcher did not collect the data that he or she will be working with, it’s imperative for him or her to become familiar with the data set. This familiarization process entails:

  • Learning about how the data was collected
  • Learning who the population of the study was
  • Learning what the objective of the original study was
  • Determining what the response categories were for each question displayed to survey respondents
  • Evaluating whether or not weights need to be applied during the analysis of the data
  • Deciding whether or not clusters or stratification need to be accounted for during the analysis of the data

The Advantages of Secondary Data Analysis

One of the most noticeable advantages of using secondary data analysis is its cost effectiveness.

Because someone else has already collected the data, the researcher does not need to invest any money, time, or effort into the data collection stages of his or her study.  

While sometimes secondary data must be purchased by a researcher looking to use it to inform a study they’re working on, these costs are almost always lower than what the expenses would be if the researcher were to create the same data set from scratch. 

Also, the data from a secondary data set is typically already cleaned and stored in an electronic format, so the researcher can spend his or her time rolling up their sleeves and analyzing the data instead of spending time having to prepare the data for analysis.

Another benefit of analyzing secondary data instead of collecting and analyzing primary data is the sheer volume and breadth of data that is publicly available today. 

For instance, leveraging the findings from studies that the government has conducted provides researchers with access to a volume of data that would have simply been impossible for the researcher to amass themselves. 

Longitudinal data at this scale is extremely powerful. The government could have been collecting data on a single population for long, extended periods of time. 

Instead of investing that time, by using the government’s publically available data to perform secondary data analysis, the researcher has avoided years of intensive labor. 

The Disadvantages of Secondary Data Analysis

The biggest disadvantage of performing secondary data analysis is that the secondary data set might not answer the researcher’s specific research question to the degree that the research would have hoped. 

If a researcher sets out to perform a study with a very particular question in mind, a secondary data set might not contain the precisely specific information that would allow the researcher to answer his or her question.

Similarly, when a researcher has a specific question or goal in mind, it can sometimes be difficult to identify secondary data that is valid for use, as the data might not have been collected during the timeframe the researcher was hoping for, or in correct the geographical region, etc.

Another disadvantage is that no matter what a researcher does to vet a secondary data set, they will never be able to know exactly how the data was collected, and how well that process was executed. 

Without being the one who is actually developing surveys and distributing them to the appropriate populations, it’s impossible to know the extent to which the researchers that collected the data went to ensure validity or quality, or if they experienced issues such as low response rates or respondents misunderstanding what a question was truly asking.

Simply put, since the researcher conducting the study did not collect the data he or she will be using, he or she ultimately has no control over what their secondary data set contains. 

Conclusion

Secondary data analysis is a convenient and powerful tool for researchers looking to ask broad questions at a large scale. 

While it has its benefits, such as its cost effectiveness and the breadth and depth of data that it provides access to, secondary data analysis can also force researchers to alter their original question, or work with a data set that otherwise is not ideal for their goals.

The next time you’re looking to perform a large-scale research study, consider secondary data analysis.


The post Why You Should Consider Secondary Data Analysis for Your Next Study appeared first on Alchemer.

How to Write Better Demographic Survey Questions (With Examples)

$
0
0

WebsiteSurveyTool

Alchemer is an incredibly robust online survey software platform. It’s continually voted one of the best survey tools available on G2, FinancesOnline, and others. To make it even easier, we’ve created a series of blogs to help you better understand what questions to ask, when to ask them, and how to ask them so you get the answers you need.

Asking demographic survey questions to collect the data you need can be somewhat intimidating. The desire to be sensitive to a diverse population can often conflict with a researcher’s need to segment their data.

And there’s nothing more disheartening than completing a survey project and realizing that you omitted key demographic questions that would have given you a deeper understanding of your data. To avoid experiencing this sinking feeling, consider including at least a few demographic questions regardless of your survey’s subject matter.

If you’re not sure how to phrase demographic survey questions, have no fear. Each section below includes examples that you can copy and paste into your next survey so you can collect data with confidence.

Your Goals Guide Your Demographic Survey Questions

Before we jump right into crafting these questions, I want to remind you that each and every survey question should be mapped back to your larger survey goals.

Consider what you hope to do with your data, and be sure that even your demographic choices roll back up to that objective.

That means that you probably don’t need to include each and every question that we’re going to cover in this article. If, for example, you’re surveying college students, questions about education, household income, and marital status are unlikely to be relevant.

Demographic survey questions cover some sensitive topics; be thoughtful about which ones belong in your survey.

Now that that’s out of the way, let’s tackle the questions themselves.

Writing Better Age-Related Demographic Survey Questions

Your first consideration when writing a demographic survey question to collect age data is how granular you need to get with your final data.

This should be structured as a radio button question, but you can choose the age ranges that you provide in each option. For example, these answer options encompass a pretty broad range of ages:

What is your age?

  • Under 18
  • 18-24 years old
  • 25-34 years old
  • 35-44 years old
  • 45-54 years old

If your research calls for more specific age data, you can offer smaller ranges:

What is your age?

  • 18-21 years old
  • 22-25 years old
  • 26-29 years old
  • Etc.

When possible, go for the larger ranges; the shorter list of options will reduce your respondents’ survey fatigue.

Also note that we’re avoiding overlapping ranges in our answer options, meaning that the same age doesn’t fall into two answers (for more on that problem check out this article).

Another option is to simply ask your respondents for the year in which they were born using a text box question. (If you go with this question type, be sure to include data validation to ensure real years are entered.)

How to Ask Demographic Survey Questions About Race and Ethnicity

If you choose to include this type of question, be sure to ask about race and ethnicity separately. Race refers to a population’s physical characteristics, while ethnicity refers to groups that share a sense of identity, history, cultural roots, and, oftentimes, geography.

Follow the lead set by the U.S. Census Bureau and other government institutions when using this demographic question. First ask, “Are you of Hispanic, Latino, or of Spanish origin?” (ethnicity), followed by a race identification question like, “How would you describe yourself?”

The first question can be a simple Yes/No radio button; the second should include these commonly accepted options:

  • American Indian or Alaska Native
  • Asian
  • Black or African American
  • Native Hawaiian or Other Pacific Islander
  • White

Stick with a checkbox question for this one so that respondents can choose multiple options if they identify as a member of multiple races. Including an open text box at the end of the question will allow for write-in options too.

Even these common distinctions can be confusing for survey respondents, and the Census Bureau is experimenting with new question wording that eliminates all mention of “race” and “origin” (read more about these efforts here).

So, if you’re looking for a demographic question to cut, this one should be at the top of your list.

Surveying Your Respondents With Questions for Sex and Gender

Like questions about race and ethnicity, demographic questions about sex and gender should be respectful and nuanced.

We’ve covered this topic in depth elsewhere on the Alchemer blog, but these are the two best ways to balance the demands of data collection with respect of your respondents’ diverse experiences:

1. Completely Open Ended Question:

Gender? ___________.

You’ll have to do some open text analysis on these responses, but it makes it very easy for people to choose their own category.

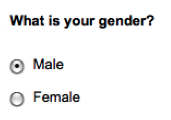
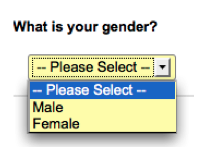
2. Options for Cross Tabulation

If you know you need this data in set categories to aid in data analysis, you can still create respectful categories without overwhelming respondents.

We suggest a radio button question like this (although what works for your particular audience may differ slightly):

Note that the best way to phrase this question is something like, “To which gender identity do you most identify?” rather than simply, “Gender.”

The Best Way to Ask Marital Status Demographics

The options for this question may seem less nebulous than questions about racial or sexual identity, but romantic relationships are often deeply complicated. Like race and ethnicity, consider carefully whether someone’s marital status really matters to your final survey goals before including this question.

If you do want to segment based on this data, the best practice is to phrase the question as follows:

What is your marital status?

  • Single (never married)
  • Married, or in a domestic partnership
  • Widowed
  • Divorced
  • Separated

Asking Survey Respondents for Education Demographic Information

When asking about educational achievement, think about whether or not you’re likely to have a large percentage of students responding to your survey. If you anticipate that many respondents will still be in school, be sure to include instructions that cover that situation.

For example:

What is the highest degree or level of school you have completed? (If you’re currently enrolled in school, please indicate the highest degree you have received.)

  • Less than a high school diploma
  • High school degree or equivalent (e.g. GED)
  • Some college, no degree
  • Associate degree (e.g. AA, AS)
  • Bachelor’s degree (e.g. BA, BS)
  • Master’s degree (e.g. MA, MS, MEd)
  • Professional degree (e.g. MD, DDS, DVM)
  • Doctorate (e.g. PhD, EdD)

Collecting Demographic Data on Employment Information

Employment information can be broken down into multiple different questions that cover employment status, hours worked, employer type, and professional status, but the most commonly asked question is simply whether or not someone is employed.

As with most other demographic questions, think about how you plan to use these data points before adding them in.

If it will be helpful in your final analysis, this is a common way of phrasing this question:

What is your current employment status?

  • Employed full time (40 or more hours per week)
  • Employed part time (up to 39 hours per week)
  • Unemployed and currently looking for work
  • Unemployed and not currently looking for work
  • Student
  • Retired
  • Homemaker
  • Self-employed
  • Unable to work

For those who indicate that they are employed, you can use survey logic to display follow-up questions about their jobs if you’re interested in gathering additional details about their professional life.

Measuring Household Income With Demographic Data

As with demographic questions about age, consider how granular you need your response data from this question to be. The fewer response options you give, the less you’ll fatigue your respondents, so keep it as short as possible.

Common ranges for this question are:

  • Less than $20,000
  • $20,000 to $34,999
  • $35,000 to $49,999
  • $50,000 to $74,999
  • $75,000 to $99,999
  • Over $100,000

I do want to point out once again that the ranges for these answer responses don’t overlap, so there’s no confusion about which response is appropriate.

Finally, consider your respondents when selecting an upper and lower limit to these response options. Students aren’t likely to be bringing in anywhere close to $20,000 per year; if you’re surveying a particularly affluent population you might miss some insight by not breaking out more choices above $150,000 per year.

Demographic Survey Questions Don’t Have to Be Scary

Being able to cross-tabulate and segment your final data based on demographic data can provide amazing insight, but throwing too many demographic questions at your audience can overwhelm (and possibly insult) them.

But if you keep your survey goals in mind at all times and follow these best practices for phrasing the questions you choose to include, and everybody can walk away happy.

The post How to Write Better Demographic Survey Questions (With Examples) appeared first on Alchemer.


Quantitative Questions Versus Qualitative Questions in Surveys

$
0
0

Alchemer is an incredibly robust online survey software platform. It’s continually voted one of the best survey tools available on G2, FinancesOnline, and others. To make it even easier, we’ve created a series of blogs to help you better understand what questions to ask, when to ask them, and how to ask them so you get the answers you need.

When designing a survey, one of the first things you need to do is decide the survey’s purpose. Asking yourself, “What is this survey for?” is important, but determining purpose goes beyond this simple question.

While the above question will help you outline what questions to ask and which topics to cover, this is just the beginning.

The crucial follow up question is, “What kind of data do I need?”

This last question is what will determine which question types you will use in your survey. Should you use qualitative questions, quantitative questions, or a mix of both?

First, let’s lock down the definitions of the terms “quantitative” and “qualitative.”

How Quantitative Questions and Qualitative Questions Affect Your Survey Data

There are two main categories of question types: quantitative and qualitative. Each has its own strengths and weaknesses when it comes to the data they yield, and which you choose will depend on what kind of data you are hoping to collect.

  • Quantitative: relating to, measuring, or measured by the quantity of something rather than its quality.
  • Qualitative: relating to, measuring, or measured by the quality of something (size, appearance, value, etc.) rather than its quantity.

Basically, quantitive data will tell you what your respondents are doing, while qualitative data offers deeper insight into why.

Getting the Facts with Quantitative Questions

Quantitative questions will result in data that is easy to convert into objective, numbers-based analysis.

Quantitative data is easier to measure using statistical analysis, because you can (usually) assign numeric values and directly compare different answers to the same questions.

Examples of quantitative questions include:

  • How many times per month do you purchase a coffee from a café or coffee shop?
  • How often do you drink coffee at home?
  • Do you prefer to prepare coffee at home or purchase from a café or coffee shop?
  • If applicable, which café or coffee shop do you go to the most often?

While the word “quantity” has the connotation of being just about numbers, that is not always the case.

In the above examples, the first two questions would be answered with a numerical value. The second two questions, however, would require a written response.

All of the above are quantitative. This is because the answers are objective, telling the basic story of the respondent’s coffee consumption and preferences. These data points are objective.

I like to think of quantitative questions as providing the kind of basic insight that you would find in a survey similar to a census.

As a survey creator asking these kinds of questions, you are really just looking for the basic data points that will enable you to perform a statistical analysis of your respondents.

The Best Question Types for Collecting Quantitative Data

There are a wide variety of options for question types that collect quantitative data, which answer your questions of “what,” “when,” and “how.”

These include, but are not limited to:

  • Radio Buttons: This is the question type to use when you want respondents to select just one option from a list of possible choices. It’s also available in grid format.

Alchemer Blog: Quantitative Questions Versus Qualitative Questions in Surveys - Radio Buttons

  • Checkboxes: Similar to Radio Buttons, Checkboxes allow respondents to choose multiple options from a list. This is also available in grid format.

Alchemer Blog: Quantitative Questions Versus Qualitative Questions in Surveys - Checkboxes

  • Drop Down Menus: This is another way to present single-select questions, and it’s available in grid format.

Alchemer Blog: Quantitative Questions Versus Qualitative Questions in Surveys - Dropdown Menus

  • Drag and Drop: A fun, interactive way for respondents to order or organize responses.

Alchemer Blog: Quantitative Questions Versus Qualitative Questions in Surveys - Drag and Drop

  • Likert Scale: This question type is an easy way to get quick insights into where respondents fall on a rating scale for a given topic.

Alchemer Blog: Quantitative Questions Versus Qualitative Questions in Surveys - Likert Scale

  • Slider Scale: This is similar to a Likert Scale, but instead of having a set number of possible responses, respondents can base their input on a sliding scale.

Alchemer Blog: Quantitative Questions Versus Qualitative Questions in Surveys - Slider Scale

  • Star Ranking: This question type will be familiar to anyone who has left a Google review. Using a one-to-five star system (with an option for “not applicable”), respondents rank quality. The grid format is shown below.

Alchemer Blog: Quantitative Questions Versus Qualitative Questions in Surveys - Star Ranking

  • NPS: Usually displayed as a ranking of 1 to 10, NPS scores help you determine how happy a respondent is with a service or product and how likely they are to recommend it to friends.

Alchemer Blog: Quantitative Questions Versus Qualitative Questions in Surveys - NPS

  • Image Select: A fun way to incorporate visuals into your survey, an Image Select question allows respondents to select an answer from a set of pictures.

Alchemer Blog: Quantitative Questions Versus Qualitative Questions in Surveys - Image Select

  • Card Sort: A combination of the Drag and Drop and Image Select question types, Card Sort allows respondents to sort cards into categories.

Alchemer Blog: Quantitative Questions Versus Qualitative Questions in Surveys - Card Sort

Asking “Why” With Qualitative Questions

In contrast to quantitative questions. qualitative questions, ask “why” in a way that is open-ended, giving respondents the space to provide greater detail about their motivations and reasoning in their own words.

These responses are more difficult to analyze because, for the most part, the answers cannot be quantified using hard numbers. Instead, when analyzing qualitative data, you must be able to think flexibly and creatively to identify important trends and findings.

Examples of qualitative questions include:

  • What do you like most about your favorite café or coffee shop?
  • How could your favorite café or coffee shop improve?

Why Ask “Why?” with Qualitative Questions

If qualitative questions are so difficult to analyze, then why bother asking them?

Qualitative data gives you insight into why particular trends exist in your quantitative data, and could reveal input that you may not have anticipated.

In the above examples, you could discover that the quality of customer service is more important than the location for café patrons when it comes to determining which coffee shop is their favorite.

Or you might find that while patrons love the quality of the coffee at their favorite shop, they would spend more time there if the shop updated their interiors with more comfortable seating.

When analyzing your qualitative question results, keep in mind your own biases.

Because numbers cannot be easily assigned to qualitative feedback, your own perceptions can make if difficult to interpret the data accurately. That said, sometimes the greatest insights into respondent behavior will be collected via qualitative, not quantitative, means.

The Best Question Types for Qualitative Data

The types of questions you can use to collect qualitative data are a bit more limited, but there is still a lot that can be done with them.

Common qualitative questions include open text questions, like:

  • “Other” Box: This is an added option included with a multiple choice radio button or text box questions that give respondents the opportunity to select “Other,” and provide the answer that most applies to them.

Alchemer Blog: Quantitative Questions Versus Qualitative Questions in Surveys - "Other" Box

  • Text Box: A short answer text field where respondents can fill in a few words or sentences about their experience. Text Boxes can also be presented in list form, which is common for contact forms or multiple response questions.

Alchemer Blog: Quantitative Questions Versus Qualitative Questions in Surveys - Text Box

  • Essay Box: Similar to a Text Box, but with more room for respondents to include more detail in their answers.

Alchemer Blog: Quantitative Questions Versus Qualitative Questions in Surveys - Essay Box

In addition to open text questions, two new question types in Alchemer allow for a mixture of quantitative and qualitative data.

  • Heatmap: This question type allows respondents to click on the areas of an image they like or don’t like and provide direct, qualitative feedback on why they reacted as they did.
  • Highlighter: Used to solicit feedback on text, the Highlighter question type allows respondents to highlight and comment on sections, providing qualitative feedback on what should be kept or altered within the passage.

When Quantitative Questions and Qualitative Questions Work Together

As you design your survey, consider how you want to use the data you collect. Chances are, you will want a mixture of quantitative and qualitative question types.

Both categories have their strengths: quantitative data gives you the facts, and qualitative data can illuminate the story behind the numbers.

But, both have their weaknesses too.

Quantitative data can be limited in its insight, but qualitative responses are difficult to analyze.

For a successful, actionable, insightful survey, chances are you will need to tap into the power of both quantitative and qualitative question types.


The post Quantitative Questions Versus Qualitative Questions in Surveys appeared first on Alchemer.

What is Regression Analysis and Why Should I Use It?

$
0
0

Alchemer is an incredibly robust online survey software platform. It’s continually voted one of the best survey tools available on G2, FinancesOnline, and others. To make it even easier, we’ve created a series of blogs to help you better understand how to get the most from your Alchemer account.

Regression analysis is a powerful statistical method that allows you to examine the relationship between two or more variables of interest. 

While there are many types of regression analysis, at their core they all examine the influence of one or more independent variables on a dependent variable. 

Regression analysis provides detailed insight that can be applied to further improve products and services.

Here at Alchemer, we offer hands-on application training events during which customers  learn how to become super users of our software. 

In order to understand the value being delivered at these training events, we distribute follow-up surveys to attendees with the goals of learning what they enjoyed, what they didn’t, and what we can improve on for future sessions. 

The data collected from these feedback surveys allows us to measure the levels of satisfaction that our attendees associate with our events, and what variables influence those levels of satisfaction. 

Could it be the topics covered in the individual sessions of the event? The length of the sessions? The food or catering services provided? The cost to attend? Any of these variables have the potential to impact an attendee’s level of satisfaction.

By performing a regression analysis on this survey data, we can determine whether or not these variables have impacted overall attendee satisfaction, and if so, to what extent. 

This information then informs us about which elements of the sessions are being well received, and where we need to focus attention so that attendees are more satisfied in the future.

What is regression analysis and what does it mean to perform a regression?

Regression analysis is a reliable method of identifying which variables have impact on a topic of interest. The process of performing a regression allows you to confidently determine which factors matter most, which factors can be ignored, and how these factors influence each other.

In order to understand regression analysis fully, it’s essential to comprehend the following terms:

  • Dependent Variable: This is the main factor that you’re trying to understand or predict. 
  • Independent Variables: These are the factors that you hypothesize have an impact on your dependent variable.

In our application training example above, attendees’ satisfaction with the event is our dependent variable. The topics covered, length of sessions, food provided, and the cost of a ticket are our independent variables.

How does regression analysis work?

In order to conduct a regression analysis, you’ll need to define a dependent variable that you hypothesize is being influenced by one or several independent variables.

You’ll then need to establish a comprehensive dataset to work with. Administering surveys to your audiences of interest is a terrific way to establish this dataset. Your survey should include questions addressing all of the independent variables that you are interested in.

Let’s continue using our application training example. In this case, we’d want to measure the historical levels of satisfaction with the events from the past three years or so (or however long you deem statistically significant), as well as any information possible in regards to the independent variables. 

Perhaps we’re particularly curious about how the price of a ticket to the event has impacted levels of satisfaction. 

To begin investigating whether or not there is a relationship between these two variables, we would begin by plotting these data points on a chart, which would look like the following theoretical example.

Regression Analysis: Plotting data is the first step in figuring out if there is a relationship between independent and dependent variables

(Plotting your data is the first step in figuring out if there is a relationship between your independent and dependent variables)

Our dependent variable (in this case, the level of event satisfaction) should be plotted on the y-axis, while our independent variable (the price of the event ticket) should be plotted on the x-axis.

Once your data is plotted, you may begin to see correlations. If the theoretical chart above did indeed represent the impact of ticket prices on event satisfaction, then we’d be able to confidently say that the higher the ticket price, the higher the levels of event satisfaction. 

But how can we tell the degree to which ticket price affects event satisfaction?

To begin answering this question, draw a line through the middle of all of the data points on the chart. This line is referred to as your regression line, and it can be precisely calculated using a standard statistics program like Excel.

We’ll use a theoretical chart once more to depict what a regression line should look like.

The regression line summarizes the relationship between X and Y.

The regression line represents the relationship between your independent variable and your dependent variable. 

Excel will even provide a formula for the slope of the line, which adds further context to the relationship between your independent and dependent variables. 

The formula for a regression line might look something like Y = 100 + 7X + error term.

This tells you that if there is no “X”, then Y = 100. If X is our increase in ticket price, this informs us that if there is no increase in ticket price, event satisfaction will still increase by 100 points. 

You’ll notice that the slope formula calculated by Excel includes an error term. Regression lines always consider an error term because in reality, independent variables are never precisely perfect predictors of dependent variables. This makes sense while looking at the impact of  ticket prices on event satisfaction — there are clearly other variables that are contributing to event satisfaction outside of price.

Your regression line is simply an estimate based on the data available to you. So, the larger your error term, the less definitively certain your regression line is.

Why should your organization use regression analysis?

Regression analysis is helpful statistical method that can be leveraged across an organization to determine the degree to which particular independent variables are influencing dependent variables. 

The possible scenarios for conducting regression analysis to yield valuable, actionable business insights are endless.

The next time someone in your business is proposing a hypothesis that states that one factor, whether you can control that factor or not, is impacting a portion of the business, suggest performing a regression analysis to determine just how confident you should be in that hypothesis! This will allow you to make more informed business decisions, allocate resources more efficiently, and ultimately boost your bottom line.


The post What is Regression Analysis and Why Should I Use It? appeared first on Alchemer.

Alchemer Adds Former KPA CTO to Leadership Team

$
0
0

LOUISVILLE, COLORADO, JUNE 9, 2021 – Alchemer (formerly SurveyGizmo) – a global leader in customer experience (CX) and voice-of-the-customer (VOC) technology – announced today the hiring of Brandi Vandegriff as CTO. Brandi was previously CTO at KPA where she led their digital transformation and created a fully integrated journey for their more than 10,000 enterprise customers. Prior to KPA, Brandi had senior technology roles at Level 3 Communications and Location3 Media. Brandi is an annual speaker at Women in Technology (WIT) and is a twice-nominated CIO of the year.  

Brandi Vandegriff

“We are excited to have Brandi join our leadership team,” said David Roberts, CEO of Alchemer. “She has the customer-experience history to help our customers achieve maximum value from the Alchemer platform.”     

The Alchemer platform provides survey, workflow, audience, communication, and analysis tools to allow any size organization to collect, integrate, and act on the voice of their customer. Alchemer also delivers industry-first solutions, such as Activated NPS, that further personalize the engagement businesses have with their customers to drive actionable feedback.  

“Building products that help customers achieve their missions is my passion,” said Brandi. “I love creating teams that are relentless in addressing customer needs, and that makes Alchemer a great fit for me.”  

About Alchemer 

Alchemer (formerly SurveyGizmo) transforms customer feedback into operational gold to create customer-centric organizations. Alchemer provides a customer-experience platform and pre-packaged solutions that enable businesses to collect and act on feedback to find, get, and keep more customers and employees. Only Alchemer puts customers at the center of everything a company does by integrating feedback directly into the systems and applications that power the organization today. Alchemer serves more than 15,000 global customers and 30% of the Fortune 500. 

The post Alchemer Adds Former KPA CTO to Leadership Team appeared first on Alchemer.

Tips and Tricks for Returning to Work

$
0
0

You can use Alchemer to smooth out your company’s return to work and the office. But there are six things we’ve learned from our own experience and things our customers have shared that make it easier. 

1. Be honest. None of us have lived through this before, so it’s new for everybody. Let your employees know that you’re figuring this out as you go, just like everybody else. Nobody has tested best practices yet.  

2. Automate. Use the Alchemer Return-to-Work Solution to automate and simplify the process. The solution includes daily Return-to-Work assessments, temperature recording, daily and cumulative reports, desk reservations, and visitor and contractor requests. Learn more here. 

3. Mobilize. Make sure employees and visitors can complete your daily health assessment on a mobile device. This will allow them to complete it in the parking lot or even at the door.    

4. Simplify. Create a QR code that takes employees to the daily health assessment. Print out the QR code and put it at every entrance. This allows people who forget to do the health assessment at home to quickly complete it at the office. When we did this at Alchemer, our compliance went from 60-70% to well over 90%.  

5. Plan ahead. Leave lots of lead time for vendors to fulfill requests. Many of them are returning to work or staffing up and things could take longer. 

6. Be patient. People have created new habits over the past 14 months and returning to work is now a new habit people must get used to.  

Establishing rules and holding to them will help people feel more comfortable and help them develop new habits. Tracking attendance helps with contact tracing, should somebody develop symptoms.  

It’s a brave new world we’re all entering together. Take care of each other. 

The post Tips and Tricks for Returning to Work appeared first on Alchemer.

Lessons We’ve Learned While Returning to Work

$
0
0

Alchemer HQ has Reopened

By the Alchemer HR Team 

As Colorado and the Greater Denver area relax Covid restrictions, we have begun welcoming our employees back to our main office. Here are some of the lessons we learned as we reopened.  

Understand Your Employees: Return to Work

When we decided to reopen, we wanted to understand people’s concerns and challenges with coming back to work. We ran the Alchemer Return to Work survey, and we were somewhat surprised by the results. It turned out not everyone shared the executive team’s excitement about returning to the office.  Many were hesitant, and for a variety of reasons.   

Several employees had adopted pets (a common trend, with shelters everywhere emptying for the first time), some had new children, others had changes to their child-care situations, several had moved further from the office, and some had started working at Alchemer during the pandemic and didn’t know what “working in the office” looked like. A few were simply unsure of the safety of working in a group environment again.

A lot had changed in people’s lives, and they had adapted to a work-from-home lifestyle.  Going back to work in an office was a disruption to the new normal. By understanding our employees’ challenges and concerns, we were able to create a timeline for returning to the office that allowed people to arrange for child and pet care, to emotionally prepare for the change, and for the company to address health concerns related to working in an office. Together we figured out the best timing

Keep Everyone Healthy: Daily Health Assessments 

To keep our employees healthy, and to comply with government regulations, employees must now complete a health assessment every day before they come to work. The health assessments also provide a record of everybody who has come into the office in case there is an outbreak, and we need to manage contact-tracing protocols.

Most people have the assessment on their phones so they can complete it easily. However, we did discover that it is easy to forget to complete the assessment before arriving at the office, so we added a QR code with it on all the doors.  In addition to the health assessment, we also communicate and enforce state guidelines for mask-wearing.

Stay Connected: New Conversations 

The pandemic has changed the way we do and think about many different things. We’re also having conversations on topics we never thought we’d be having at work.

Vaccinations have always been a personal matter. Now that subject is front and center in the workplace.

Can you work in the office if you’re not vaccinated? Do you have to prove that you are vaccinated? What if you can’t be vaccinated for health, religious, or other personal reasons? Does the company have a right to this information? This is new territory for businesses, and talking about it is the best way for teams to work through these questions.  

Equally, people almost never discussed concerns about being in a building with other people prior to the pandemic. A conversation about a safe work environment used to focus mainly on other peoples’ behavior – now it must include more traditional health concerns as well. Open dialogue about office cleanliness and how suppliers and other visitors must demonstrate health compliance is very important to helping people feel comfortable about returning to the office.

Be Aware: New Habits and Old Habits 

One of the biggest challenges every company will face is that everyone has developed new work habits over the last 14 months. We’ve become accustomed to our new normal, which has blended home life with work life.  

Working from home has meant no commute and not having to put on shoes. It also meant being immediately present for young children, pets, and elderly parents.  Going back to work requires dusting off old habits – lining up care for those who need it or getting up early enough to make the train or drive the commute. Something as basic as thinking about lunch once again requires planning ahead versus simply opening the refrigerator.

Identifying and restoring old habits will take some thought and time, as overcoming inertia and embracing change are rarely easy. Talk about the changes people need to make in order to return to the office. Remind each other that we all did it before.

Brush Up: Social Skills 

Working from home has made it easy to disconnect from people because they aren’t sharing the same physical space with you. But in-person conversations do not come with a mute button, and it’s much harder to get away with multi-tasking in person. As we’ve started coming back together, we’ve noticed we’re all a bit rusty at being around people.

On one hand, we know more about each other personally because our homes were often our Zoom backgrounds, and pets and children often joined our calls. But we need to brush up again on what it means to be in conference rooms together, to work in cubes, and to respect each other’s physical space. We don’t need our computers to communicate anymore – we can look each other in the eyes and connect three-dimensionally. Let’s remember how to do that.

Be Patient

Being more patient is probably one of the skills we will all need to embrace. Getting back to normal will take time as people emerge from their home offices and figure out how to operate in a post-pandemic world. This is true not only for employees, but for vendors and suppliers as well. 

Especially office supply companies, many of whom made significant changes to their staffing to weather the downturn in business created by everyone working from home. We have a supplier who previously handled just the greater Denver area, but is now responsible for the whole state. As more businesses come back to work, we hope they can return to the old coverage model, but for now, our supplier can’t be as responsive as they were before the pandemic, and we need to be more patient as a result. 

Recognize This is New For Everyone 

There hasn’t been a similar pandemic for more than 100 years, so there is no playbook for how we all come back together. Some will eagerly embrace a return to the office, while others will be hesitant.

And some things that were common before will likely change or disappear altogether. For now, we at Alchemer have stopped donut and bagel days just because we’re not sure if it’s safe or proper. Will they come back? We’ll have to see. When we see each other for the first time, how do we greet each other? Hug? Shake hands? Fist bump? Wave? We need to work that out, too.

At Alchemer, we believe it’s important that we come out of our home offices, basements, and attics and figure out how to return to working together safely. We believe we serve our customers better when we can brainstorm and whiteboard and solve problems in the same room. For various reasons, not everyone can or will return to the office, but we know we’re a better company when most of us are together. Our aim is to come back together thoughtfully, deliberately, and with consideration for all that has changed.

The post Lessons We’ve Learned While Returning to Work appeared first on Alchemer.

Reach More People in Their Language

$
0
0

New Alchemer University Content teaches you how to launch multilingual projects and add quotas 

By Alli Milne and Andrew Sturtz  

Global research, such as exploring new markets, often means talking to people in a language other than English. Sometimes it also means setting different kinds of quotas so that you get the right mix of respondents for your research.  

To help you translate and set quotas, Alchemer University launched a new program on June 30, 2021 – Tools: Translations and Quotas. 

This program includes two courses to help users build and launch multilingual projects, and to add different types of quotas into projects. The Text and Translations Tool removes boundaries from collecting data from multilingual audiences.  

The Quotas Tool allows users to set limits on the desired number of responses captured according to defined conditions. This is important when you include an incentive and want to limit the number of responses, or you want to get an even distribution of respondents across conditions for a market research study. 

New courses include: 

  • Course 1: Text and Translations 
  • Course 2: Quotas 

Course 1: Text and Translations 

By the end of this course, you will be able to: 

  • Translate a project into multiple languages  
  • Understand the different options for adding multiple languages 
  • Share multilingual projects   

Course 2: Quotas 

By the end of this course, you will be able to: 

  • Identify the different types of quotas and how to best use them 
  • Set quotas for total responses, logic segments, and links  
  • Review and monitor project quota information 

New! Alchemer University Feedback Survey 

We are looking for feedback on your Alchemer University experience so far. Please take our survey within the Reports Program, or click here:  https://survey.alchemer.com/s3/6314076/tools 

Alchemer University Keeps Growing 

Since the first program was released in early 2020, more than 32,000 Alchemer users have successfully enrolled and participated in AU Courses to increase their knowledge and usage of the application. Check out our other programs as well: 

  • Beginning Essentials Level 1 
  • Beginning Essentials Level 2 
  • Account Administration 
  • Building Advanced Questions 
  • Actions  
  • Logic 
  • Style 
  • Email Campaigns 
  • Distribution 
  • Managing Responses 
  • Reports 
  • Exports 

The post Reach More People in Their Language appeared first on Alchemer.

Same Survey, More Data: Combining Identical Surveys

$
0
0

By Michael Cordeiro 

Have you ever found the need to compare the responses collected across time to make more informed decisions? 

It has become a common practice to collect feedback from respondents about their experience with the products and solutions over time. If you are conducting identical surveys to your employees or customers on a recurring schedule, it’s incredibly valuable to be able to pair your data and responses together to view trends over time.   

With Alchemer’s Combine Related Survey Data feature, it’s as simple as building out your Standard Reports! Below we’ll explore how this is done and why it is important to be able to recognize and act on the feedback that you collect! 

Not all surveys are the same, just the copies! 

First, it’s important to note that the combined survey results feature relies on two exact same surveys. Meaning, each question, email action, and anything found on the Builder tab must be identical to the survey where the combined results report will exist. We recommend that the surveys used are copies of one another to ensure the same values exist between each project. 

The Setup

Here, we are using a Customer Satisfaction survey example between the months of June and July: 

When your responses have been collected across the designated time period of your study, navigate to either survey used and its report section via Results > Reports.  

Here let’s create a new report, titling it so it is easy to know that this is a report combing two surveys. We will use the title of “Combined Report for Customer Satisfaction Survey June-July” to make this as recognizable as possible! 

Next is where the magic begins to unfold. 

Within the created report, select the Combined Results option in the top right. This begins the process of taking two sets of results across projects, merging them together to create one, fine-tuned and powerful report: 

Now let’s type in the name or survey ID of the project that we would like to combine the results for and start making sense of what your customers have to say. Alchemer will begin to auto suggest the project titles that exist in your account as users type in the search box: 

We will select the June survey here since this example exists in the July customer satisfaction survey. 

Once we select the June survey here, you’ll see that we have an additional set of responses within the report that was not collected and viewable via the individual responses page. The data within the surveys added via the combine results feature will be aggregated together, accessible in one easy to understand report! 

Prior to combining results, we see that there are 10 responses within the project. Below we see a total of 35 responses within the created report, as 25 responses existed in the June 2021 version of the project: 

Data Analysis isn’t a One-Day Ordeal 

The best decisions are made when researchers look at change over time, and Alchemer’s Combine Results feature does just that! By looking at changes and trends by month, quarter, or year, Alchemer users are enabled to make the most informed decisions and plans for their customers, users, and employees too! 

For more information on the Combined Results Feature, check out our excellent help page on Combining Related Survey Data! 

The post Same Survey, More Data: Combining Identical Surveys appeared first on Alchemer.


Returning to the Office Creates New Concerns for HR

$
0
0

Note from the Alchemer Webinar on HR.com

Recently, Alchemer hosted a webinar with HR.com to talk about the challenges of returning to the workplace after 14 to 18 months away. The panelists – Vanessa Bagnato, Director of Enterprise Solutions, and Sue Bonsor, Director of Customer Support at Alchemer – talked about the different workplace models and considerations for developing a return-to-work plan, and involving employees in the decision during the webinar.  

Different Work Models 

Returning to the Way it Was. Even though we now must create more hygienic work environments with less communal food, this model tries to recreate the way the organization worked before the pandemic.  

Clubhouse Model. This hybrid model encourages employees to come to the office when they need to collaborate, and work from home when they need to work without interruptions. In this case the office serves more as a hub. 

Activity-based Working. In this model, employees work from the office, but no longer have assigned desks. Instead, they spend their day working where it makes the most sense – in a team huddle, with one other person, or alone. Some companies use a reservation process to ensure each employee has a desk. This allows organizations to operate in smaller spaces with fewer desks than employees. 

Hub-and-Spoke Model. This approach creates smaller satellite offices closer to where employees live, cutting commute times while giving employees the benefits of face-to-face interactions. 

Fully Virtual. This model is how most companies worked during the pandemic, where employees work from any location, such as home or anywhere they like.  

How Others Are Doing It 

A Gartner study showed that 82 percent of companies intend to permit some remote working as people return to the office. However, 30 percent of corporate leaders worry about maintaining their corporate culture without people in the office.  

Google has announced plans to reopen offices with some locations returning to work before September first. However, offices will operate at limited capacity, taking regional health guidelines into consideration. Google also announced that they expect employees to live within commuting distance of an office – in effect, choosing a hybrid model over the fully remote model that some other tech companies, such as Twitter have chosen. 

Allstate Insurance surveyed employees and found that many employees did not want to return to the office full-time. After analysis, Allstate realized that most functions don’t require an office setting. They announced that 75 percent of the roles can be performed remotely, while 24 percent can be done on a hybrid basis. The remaining 1 percent will return to a pre-COVID style of office setting. This includes some top executives and certain customer-facing roles. 

Apple employees did not feel heard and are pushing back against a new policy that required them to return to work three days a week. Employees wanted a more flexible approach to work remotely with over 80 employees writing a letter to leadership expressing their thoughts and desire to be asked. Many employees have chosen to leave, especially in light of both Facebook and Twitter telling employees they can work from home forever. 

Atlassian revealed a new Team Anywhere policy, the company requires staff to travel to their nearest office four times a year. Based on employee surveys, the company expects to have about 50-percent office attendance. 

Considerations 

When you develop or finalize your Return to the Workplace plan, there are several considerations to take into account.  

  1. Establish what your employees want and what your company needs to maintain your corporate culture, then determine the return-to-work approach that is best for your organization. 
  2. Map out a timeline to set expectations for employees. Employees need to plan for childcare, family care, commuting, pet care, and other situations that might have changed over the past 16 months or so. Even if the timeline changes, employees will be more understanding if there is transparency about expectations. A McKinsey study found that employees want more certainty about post-pandemic working arrangement, even if businesses don’t yet know what to say. According to the McKinsey study, organizations that have already articulated more specific policies about the workplace have seen employee well-being and productivity rise. 
  3. Get feedback from employees on the plan.  
  4. Evaluate the physical workspace and ensure that it is safe for your employees.  
  5. Consult with local government guidelines, which can vary by city, county, state, province, and country.  
  6. Determine policies surrounding employee screenings and protocols. 
  7. If you require daily health assessments or other check-ins, Alchemer found that posting a QR code at every door really simplified compliance. 
  8. Determine how you will deal with vaccinated versus non-vaccinated employees. This is a very sensitive topic that could become an inclusivity issue. 
  9. Decide what, if any, protective gear or cleaning supplies you need. 
  10. Determine your corporate travel policy both domestically and internationally. 
  11. Do not expect your plans to be static. You will need to monitor employee satisfaction (pulse surveys really help here) and be flexible with iterations due to employee feedback or changes to government guidelines or other factors. 

With the dangerous Delta variant cropping up, we all should plan to have our plans change. Remember to continue to communicate with employees and government health officials to protect your people. 

Many other subjects were covered in the webinar, which you can listen to here. 

To learn about Alchemer’s Return-to-Work solution, click here

The post Returning to the Office Creates New Concerns for HR appeared first on Alchemer.

Learn How to Pass Data to Improve Your Customer Experience

$
0
0

New Alchemer University content teaches you the power of passing data between systems and projects 

By Alli Milne and Andrew Sturtz   

One of the most powerful aspects of Alchemer is the ability to pass data between projects and systems. This allows you to pass data within and outside Alchemer to improve the respondent experience, simplify workflows and enhance data analysis.  

Learning how to pass data allows you to know exactly who a respondent is without ever asking them to provide their name or email. It also makes it easy to personalize emails or project questions, so the entire experience feels customized to the individual respondent.  

With Alchemer, you can pass data from project to project or from the Alchemer platform to or from third-party systems, such as a CRM or email marketing tool. The Passing Data program includes four courses to help users pass data in and out of Alchemer using Merge Codes, URL Variables, and Hidden Value Actions. 

The new course includes four lessons:  

  • Introduction to Passing Data 
  • Passing Data: Leading Practices 
  • Passing Data: Use Cases 
  • Passing Data: Building an Example  

Course 1: Passing Data 

By the end of this course, you will be able to: 

  • Identify the purpose and benefits of passing data 
  • List the leading practices for passing data 
  • Identify use case examples for passing data 
  • Build a project that includes features to pass data 

New! Alchemer University Feedback Survey  

We are looking for feedback on your Alchemer University experience so far. Please take our survey within the Reports Program, or click here.

Alchemer University Keeps Growing  

Since the first program was released in early 2020, more than 34,000 Alchemer users have successfully enrolled and participated in AU Courses to increase their knowledge and usage of the application. Check out our other programs as well:  

  • Beginning Essentials Level 1  
  • Beginning Essentials Level 2  
  • Account Administration  
  • Building Advanced Questions  
  • Actions   
  • Logic  
  • Style  
  • Email Campaigns  
  • Distribution  
  • Managing Responses  
  • Reports  
  • Exports  
  • Tools: Translations and Quotas 

The post Learn How to Pass Data to Improve Your Customer Experience appeared first on Alchemer.

What is a Longitudinal Study?

$
0
0

Survey projects can fall into one of two main categories: longitudinal and cross-sectional.

Each one has its strengths and weaknesses, and which category is right for you will depend on what kind of data you are collecting and what kind of insights you need to glean from the results.

Let’s take a look at longitudinal and cross-sectional studies and when they work best for business.

What is the Definition of a Longitudinal Study?

A longitudinal study occurs over many touch points across an extended period of time. They are usually observational in nature. By observational, we mean that the survey makers are not interfering with the subjects or survey respondents.

The most important distinction between longitudinal and cross-sectional studies, for our purposes, is the timeline. Instead of a researcher collecting data from varying subjects in order to study the same variables, the same subjects are surveyed multiple times, in some cases, over the course of many years.

Many medical studies are longitudinal, following the same 100 individuals over the course of years.  Using the same subjects in a longitudinal study allows for measurable change over a period of time to be collected.

While popular for the medical and scientific communities, longitudinal studies can have big benefits for business.

With them, you can track and measure topics as varied as:

  • Market trends
  • Brand awareness
  • Product feedback
  • Customer satisfaction
  • Employee engagement
  • and much more

The Three Kinds of Longitudinal Studies

There are three distinct kinds of longitudinal studies. They are:

  • Panel
  • Cohort
  • Retrospective

A panel study will involve a representative sample of subjects, usually found through a panel services company.

In contrast, a cohort study observes subjects that fall in a similar group or demographic based on shared characteristics. This could include region, age, or common experience.

A retroactive study takes advantage of historical data, often times in comparison to updated data.

What is a Cross-Sectional Study?

A cross-sectional study, the not-so-distant cousin to longitudinal, is intended to compare multiple population groups at a single point in time. Instead of collecting data over time on a single variable, a cross-section is framed, allowing a researcher to see differences among population subsets in several categories.

An example would be a study on the benefits of jogging. In this study, multiple measurements are taken like resting heart rate, body mass index,  and blood pressure. These would be taken all across groups of varying levels of exercise.

Researchers aren’t collecting data from a single subject over several years to learn about the effects of jogging, but from many subjects just once. This is often referred to as a ‘snapshot.’

Longitudinal and Cross-Sectional Studies: Advantages and Disadvantages

The key advantage to longitudinal studies is the ability to show the patterns of a variable over time. This is one powerful way in which we come to learn about cause-and-effect relationships. Depending on the scope of the study, longitudinal observation can also help to discover “sleeper effects” or connections between different events over a long period of time; events that might otherwise not be linked.

There are, of course, drawbacks to longitudinal studies, panel attrition being one of them. If you are dependent on the same group of 2,000 subjects for a study that takes place once every year, for twenty years, obviously some of those subjects will no longer be able to participate, either due to death, refusal, or even changes in contact information and address. That cuts down on usable data you can draw conclusions from.

Another weakness is that while longitudinal data is being collected at multiple points, those observation periods are pre-determined and cannot take into account whatever has happened in between those touch points. A third disadvantage is the idea of panel conditioning, where over time, respondents can often unknowingly change their qualitative responses to better fit what they consider to be the observer’s intended goal. The process of the study itself has changed how the subject or respondent views the questions.

Cross-sectional studies aren’t perfect either. Because of their single survey nature, they aren’t fit to make conclusive observations about the direction of any given association between variables. However, the benefits could outweigh the narrow scope disadvantages for many businesses.

For one, cross-sectional studies are affordable when compared to a similar longitudinal study. With fewer touch points (no follow up), they are also much quicker in reaching an observational conclusion. Also, provided the sample size is carefully chosen, cross-sectional studies can be helpful in representing entire populations, rather than subsets. This can be very beneficial when considering policy changes.

Logintudinal Studies vs. Cross Sectional: Which is better?

Neither, really. It all depends on what you need for your business.

The idea behind both longitudinal and cross-sectional studies is, again, to create the best process in order to collect the most useful and actionable data. One is certainly not better than the other. They both serve a very important purpose, in different ways.

The deciding factor on which you use may be the number of variables you’re trying to study, the amount of time you have before published results are expected, your budget, or, perhaps most importantly, the nature of the event you’re studying.

Ready to get started with your own study? Start a trial at Alchemer.

The post What is a Longitudinal Study? appeared first on Alchemer.

Running Brand Awareness Studies

$
0
0

Our Panels team is helping many customers run Brand Awareness Studies to enable marketing teams to understand where they stand today and how their advertising and marketing efforts are moving the needle. After a year like 2020, this makes a lot of sense. People’s buying and consuming habits changed dramatically during the lockdown, and now people are changing their habits again.  

Longitudinal Reporting for Brand Awareness 

The key to doing brand awareness surveys is to create a standard report that you can run repeatedly and then compare the results over time. The results are shown in what is called Longitudinal (over time) Reporting. For this kind of study, you will need a Professional or Full Access account.  

For brand awareness studies, you will want to reach a random sample of people in your target markets in order to get truly useful information. Many companies turn to the Alchemer Panels Team to help them find the right groups of targeted respondents. 

The Advantages of Longitudinal Studies 

Brand awareness studies are best conducted with a standard survey that you run repeatedly and measure over time. By regularly asking the same questions – every month or quarter – you can see the effects of your marketing campaigns over time. Your Longitudinal Reports will show you how your audiences’ perceptions of your brand change and allow you to compare the results to programs and events.  

This approach allows you to understand and explain the impact of marketing programs, news reports, and other events that can raise or lower your scores.  

Types of Questions 

You can create a longitudinal report with a number of standard questions. The key is to restrict answers to a specific pre-determined set to directly compare March with October, for example.  

The types of questions that can be used in longitudinal reporting include: 

  • Radio Buttons 
  • Dropdown Menu 
  • Checkboxes 
  • Net Promoter Score 
  • Likert Scale Rating 
  • Image Select (single and multiple) 
  • Cascading Drop Down Menu 

You can set the intervals for reporting to Daily, Weekly, Monthly, or Annual. Then you can choose from one of eight different report styles.  

Metrics You Can Chart 

The metrics you can measure include: 

  • Option Count (this is the default) which plots a data point for each answer option 
  • NPS® Score, which plots the score calculated 
  • Sum, which is calculated by multiplying the number of responses for each option by its numeric value 
  • Average, which calculates the Sum divided by the Total Responses (great for Likert scales) 
  • Min, which plots the minimum value across all responses 
  • Max, which shows the maximum value across all responses 
  • Standard Deviation, which plots the extent of deviation for the group 
  • Variance, which plots how far a set of numbers are spread out from the mean 
  • Total, which plots the total responses to a question 
  • Hidden, which indicates the total responses that did not answer the question because it was hidden 
  • Skipped, which shows the total responses that did not answer the question despite seeing it 

Other Applications of Longitudinal Studies 

In addition to brand awareness studies, longitudinal reports are great for: 

  • Market trends 
  • Product feedback 
  • Customer satisfaction (including NPS) 
  • Employee engagement 
  • Customer usage 
  • Medical studies 
  • Population trends 

To learn more about Longitudinal studies, visit read this blog, “What is a Longitudinal Study?” Or you can jump straight to our documentation on Longitudinal Reporting.  

The post Running Brand Awareness Studies appeared first on Alchemer.

Accelerate Emails and SMS Campaigns with Contact Lists

$
0
0

By Michael Cordeiro 

How often are you collecting information from the same core group of survey respondents? 

In today’s market, it has become so important to poll a group consistently over time. With Alchemer, we have a way to reach the same core group of respondents without having to import them into a new email or SMS campaign each time you need some insight. 

Enter the Contact Lists feature! 

Contact Lists is a feature that helps Alchemer users accelerate data collection and ensure that the right groups are being consistently polled. Really, it allows you to skip the step of adding contacts each time a new campaign is being created. Below we will dive into how to make a Contact List and where to use them! 

The Setup 

To create a Contact List, start by clicking Audience from the left-hand navigation menu: 

When Audience is clicked, users see a screen displaying all previously built out contact lists in the platform. Select Create New List to create a new library of contacts. Once Create New List is clicked, users first will name the list to easily identify the purpose and targeted audience that the list focused on. For this example, we will name the list Customer Success (CS) to target an internal CS department:

Once you have named the list, we are ready to upload a contact list file! We upload a CSV, XLS, or XLSX file type containing information related to the contact that we would like to exist in each response (email, first name, last name, team, location, etc.). Check the box for header if your file includes a header row labeling what exists in the column (email, first name, last name, phone number, etc.):

At the bottom of the pop-up window, select Create List. Next, we see a new window appear that allows us to match each column from the file with a field in Alchemer. We then match each column header with a corresponding field it is linked to for data analysis, and click Continue:

Once continue is selected, our Contact list is ready to send email campaigns or SMS campaigns! The newly created list is now displayed under the Audience section and is ready to be used:

Adding Contact Lists to Projects

Now let’s use our contact list globally across all surveys needing some feedback from those respondents! To do this, first build out your project and questions that you would like to ask. When satisfied with the survey build, add an email campaign to the survey by navigating to the Share Tab, scrolling down to Campaigns and Source Tracking to click Send via Email Campaign:

This brings a user to the Email Campaign Designer. We will create the campaign to our specifications and select Next: Add contacts to leverage the Contact List. On the Contact Tab of the email campaign, click Add Contacts, and then Use an Existing List. From the dropdown that displays, we see our created Customer Success Team contact list!

Choose the contact list that one would like to use with the dropdown menu. When Import Contacts is clicked, we see that the list added to the audience section exists in the email campaign and it is ready to be sent! Navigate to the Send campaign tab and your email campaign to send the email to the list referenced:

Contact Lists are designed to be used globally across many projects in an Alchemer account. Any email campaign created within an Alchemer account with Contact lists can accelerate its builds by referencing a contact list, thus removing a step of manually adding contacts to a single campaign at a time!

The best decisions are made from concise data collection against targeted populations

Consensus in collected data is best measured by persistent polling of key stakeholders and teams in an organization. The most informed decisions rely on being able to look at change over time, across a particular team, customer, or business. When users leverage Contact lists, it enables teams to act on their targeted audience swiftly and efficiently.

The post Accelerate Emails and SMS Campaigns with Contact Lists appeared first on Alchemer.

Viewing all 755 articles
Browse latest View live